New Dragon Widget Features, June 2022

NEW: Improvable Sections Widget!
This widget is very similar to our Improvable Questions widget except that instead of showing which Questions lost the most points and can raise your Overall Score by fixing them, this widget shows which Sections, Major and/or Minor, that are costing you the most points and what your Overall Score would be if all of the questions in each section had scored the maximum.
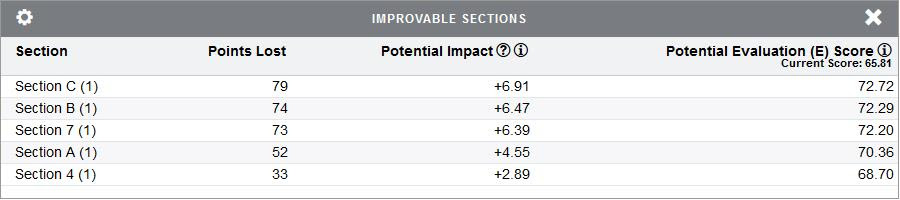
This widget has three of the same four columns that the Improvable Questions widget has:
- Points Lost (total of all the points lost for the entire section)
- Potential Impact (percentage of points lost)
- Potential Evaluation Score (your current Overall Score and what your new Overall Score could be if the questions in the sections all scored the maximum)
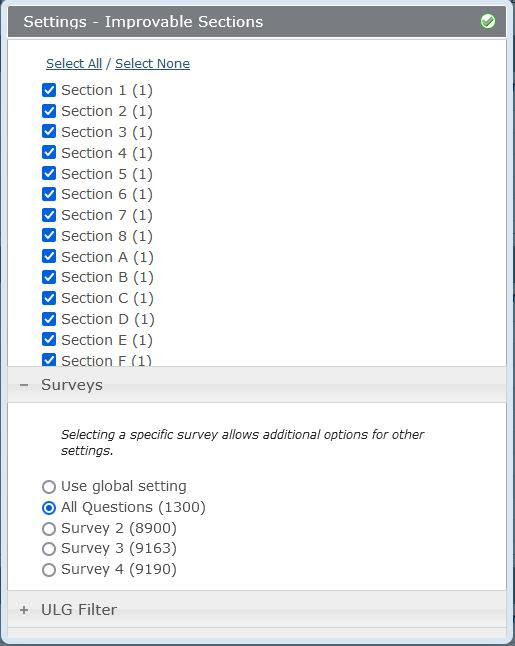
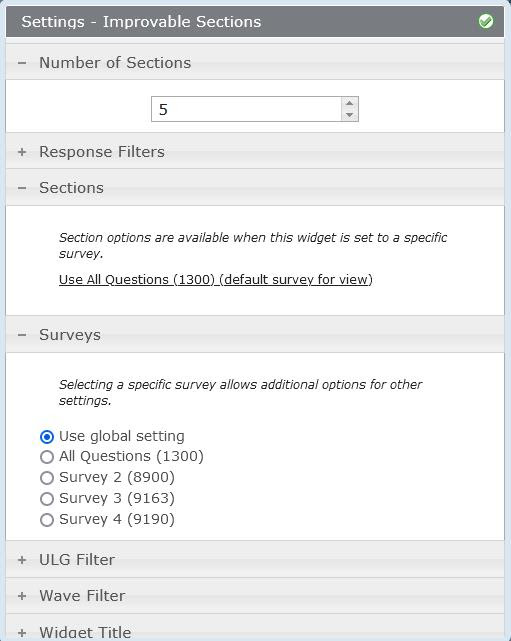
If you select a specific survey, you can manually select which Major and Minor sections to display (up to the number of sections you choose to display).
The widget will default to showing five Major or Minor sections losing the most points on your survey. You can increase or decrease the number of sections shown in the “Number of Sections” configuration.
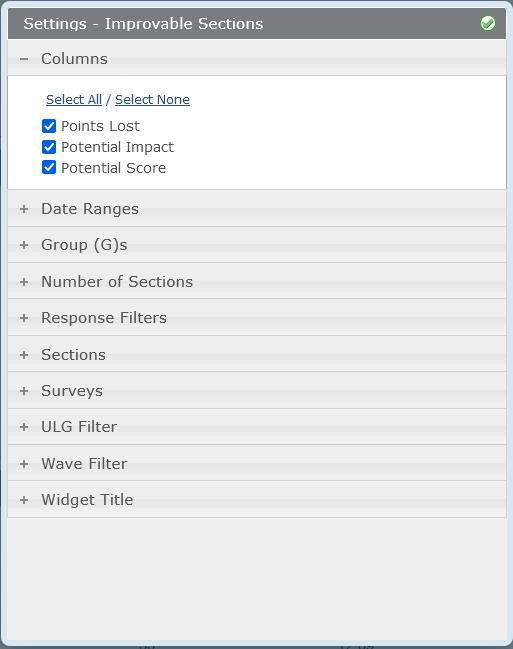
As you can see, all of our typical filters are present for this widget’s configuration including Date Ranges, Group, ULG and Wave filters, etc.
Our goal with this widget is to help quickly identify the problem areas on a survey so that the end client knows where their efforts should be focused to increase their scores.
Update to the “Trending – Sections” widget
(previously announced)
We have added a Toggle mode which allows the end-user to control which section they want to display. This effectively changes the widget from a static dashboard into a dynamic report.
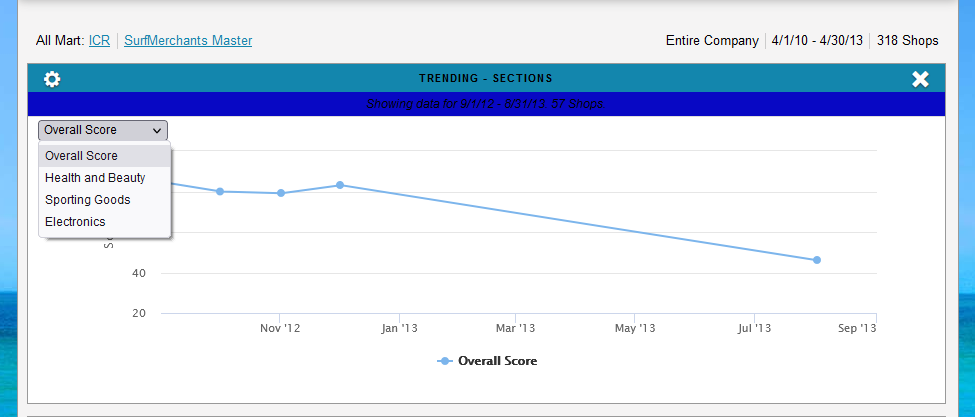
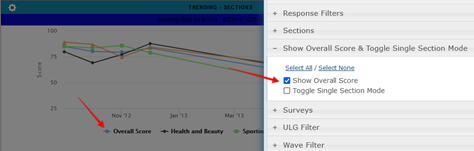
To configure this, you’ll need to go into “Show Overall Score & Toggle Section Mode” configuration in the Trending Sections widget.

It contains two independent checkboxes that will affect Dragon data. The first will allow Overall Score data to be added to the widget. Previously only sectional data was available.
The second option allows the user to modify the widget so that a single data line is only shown at once. The end-user can then select which section (or Overall Score if the setting is enabled) via a pulldown on the display of the widget.
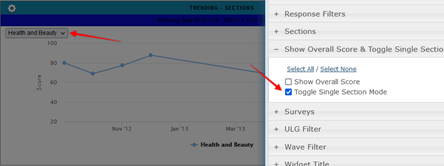
When the end-user changes their selection, the data in the widget will automatically reload and display data for the selected widget.
One important note, due to graphing limitations, when this widget is set to Single Selection Mode, the widget will not print to PDF. This does not impact any other widgets.